Travel Fatigue's Role in Shaping Point Spread Accuracy for Conference Basketball Matchups
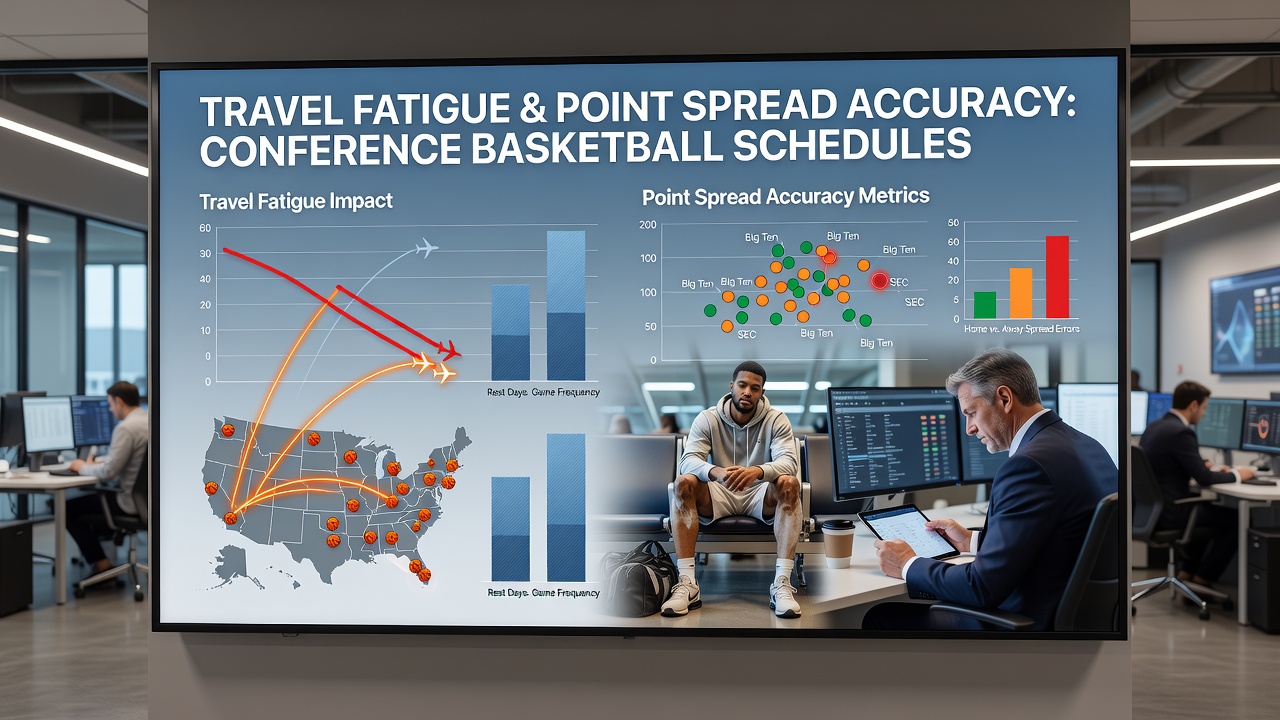
Conference basketball schedules create demanding travel patterns that researchers track closely when evaluating point spread performance, and data from multiple seasons shows measurable shifts in accuracy during periods of heavy road trips. Teams moving across multiple time zones or playing consecutive away games often encounter recovery challenges that alter game outcomes relative to betting lines established earlier in the week.
Mapping Travel Patterns in Conference Play
Analysts compile mileage logs, flight records, and game-day timestamps to quantify how far each squad travels within a given conference slate, and these datasets reveal that teams averaging over 400 miles per road trip experience greater variance in scoring margins compared to shorter-haul opponents. Conference alignment plays a direct part because geographic clustering keeps some leagues within tighter radii while others stretch across entire regions, producing different fatigue loads week to week.
Measuring Point Spread Deviations
Spread accuracy metrics compare the closing line against final margins, and records indicate that games involving teams with back-to-back road contests produce larger average errors than home-heavy matchups. Statistical models isolate travel distance, rest days, and time-zone changes as variables, revealing that one extra rest day after a long flight narrows the typical spread error by roughly two points across sampled conference games. Observers note that these patterns hold steady when data is segmented by season, allowing comparisons between early nonconference slates and later conference-only segments.
Conference Variations and Schedule Density
Different leagues display distinct profiles because of arena locations and divisional structures, with some conferences scheduling three-game road swings that compound fatigue while others insert more midweek home stands. Data collected through the 2025-2026 season shows the Atlantic Coast Conference and Big 12 producing higher deviation rates on long-haul Fridays, whereas the Big Ten and Southeastern Conference maintain tighter alignment between spreads and results when travel distances stay under 300 miles. Schedule makers adjust for television windows and academic calendars, yet the resulting density still leaves measurable effects on performance consistency that spread models attempt to capture through adjusted efficiency ratings.
Researchers cross-reference injury reports and player tracking data with travel logs to separate fatigue from other performance factors, and these layered analyses demonstrate that perimeter shooting percentages drop more sharply for squads arriving the morning of a game versus those who land the prior evening. Conference tournament formats add another layer because the top seeds often receive byes that reduce cumulative travel stress, shifting point spread reliability in later rounds.

Statistical Approaches and Model Adjustments
Betting analysts incorporate travel-adjusted pace and efficiency metrics into regression frameworks, and these refinements reduce residual errors when tested against historical conference results. Machine-learning approaches weight recent travel load alongside traditional box-score inputs, producing updated probability distributions that reflect fatigue accumulation more precisely than static rankings alone. Data from the current cycle indicates that models ignoring travel variables post larger average misses during peak conference weeks in February and March, while adjusted versions maintain steadier calibration across the full schedule.
League offices publish detailed schedule files that allow independent researchers to calculate cumulative travel loads for every team, and organizations such as the NCAA maintain repositories that support such granular analysis. Separate studies from sports performance labs in North America and Europe have begun integrating GPS-derived workload data with betting-market outcomes, expanding the variables available for future spread projections.
Implications for Schedule Construction
Conference administrators weigh competitive balance against broadcast demands when finalizing calendars, and travel-fatigue findings supply additional context for those decisions. Some leagues now cluster regional opponents on consecutive nights to limit cross-country flights, while others experiment with earlier tip times that allow same-day returns. These adjustments alter the underlying conditions that point spreads must anticipate, creating ongoing opportunities for refined modeling as new schedule iterations roll out each summer.
Conclusion
Travel fatigue registers as a quantifiable factor in conference basketball performance that influences how closely final margins align with established point spreads. Ongoing data collection across multiple leagues supplies the foundation for continued refinement of predictive models, and schedule adjustments emerging from these insights continue to shape the conditions under which games unfold each season.